Mapping wildfires
Using remote sensing to measure impact and act
2014
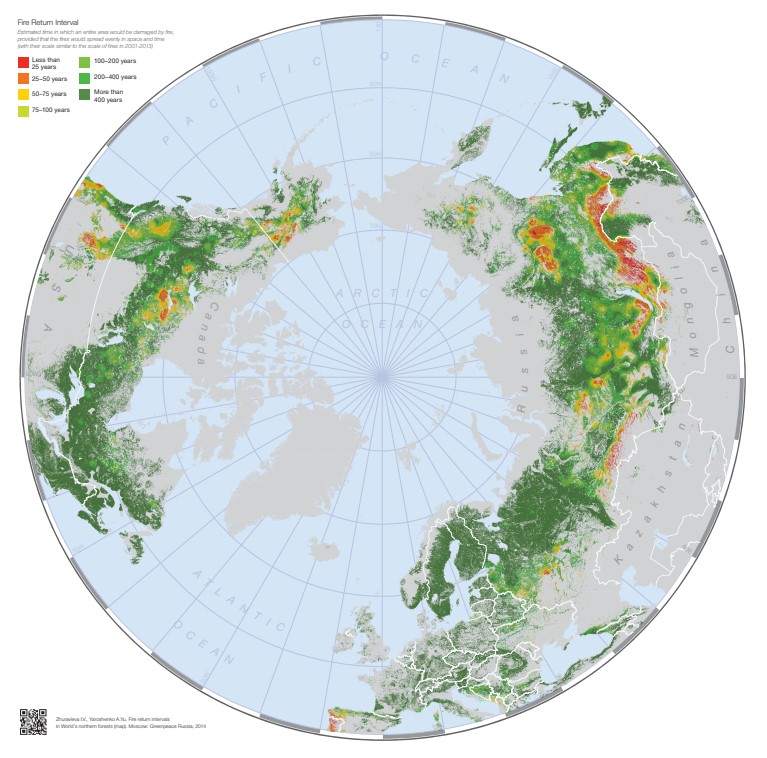
The paper “Fire return intervals in world northern forests” released. FRI is an important indicator of the role of fire in forest landscapes showing how soon fire returns to the same place
2017
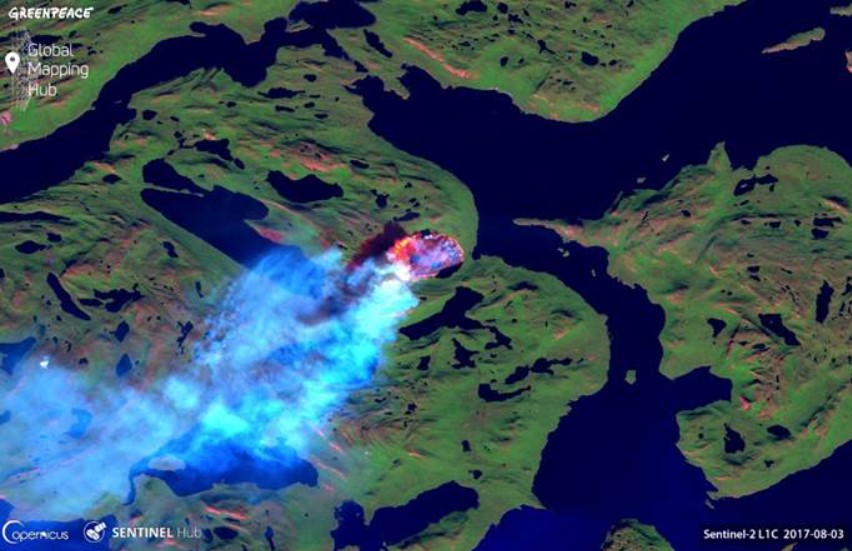
Investigation of the largest wildfire in Greenland released in collaboration with UnEarthed
2018
“Near real-time global hotspots” tool released showing hotspots provided by VIIRS sensor on Suomi-NPP satellite with a spatial resolution of 375 m
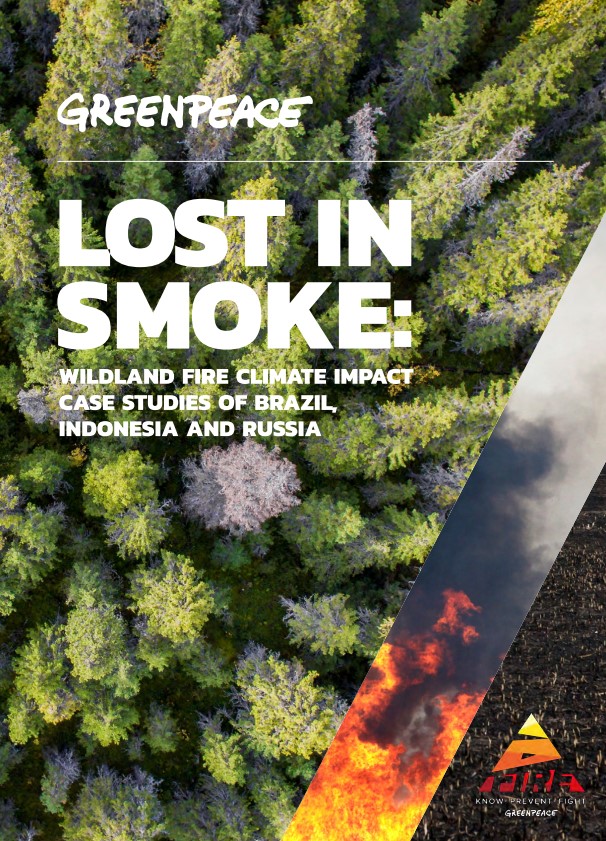
The “Lost in Smoke” report released discussing the impact of wildfires globally on climate change
2019
Spatial correlation between wildfires and human activities was investigated. See the results and methodology on this map
A map of stories from people suffering from wildfires all over the world released
Before/after images of wildfires scorching Israel released
Animation of the black carbon emissions from Siberian wildfires released
Timelapse of hotspots in Lebanon released
Brazilian primary forest and MODIS hotspots monitoring tool with current Landsat-based mosaic released
2020
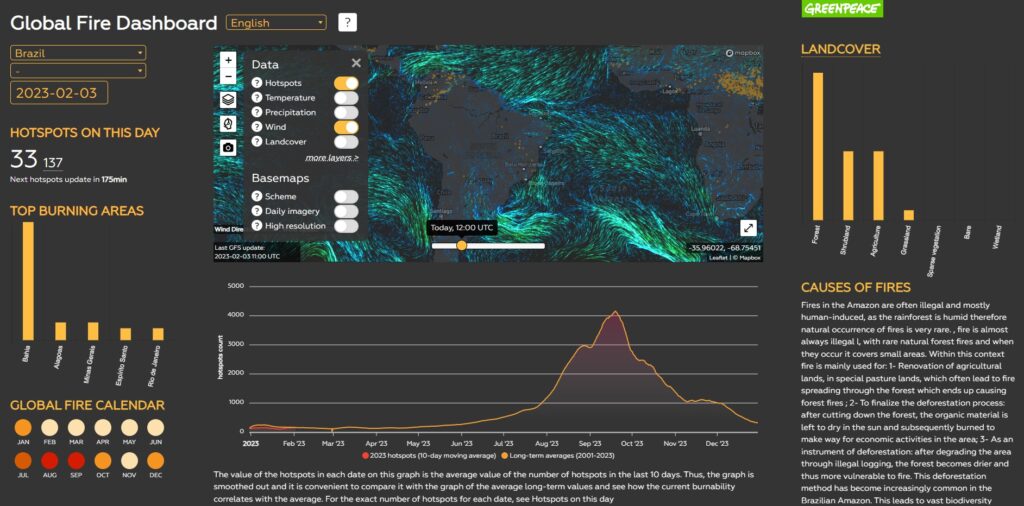
The global wildfire dashboard and fire prediction calendar released. The tool provides data for planning and reactive activities. Long-term statistics can be used to predict fire seasons, satellite imagery and hotpot data can be used to monitor the development of a fire in near real time, weather conditions and landcover can help make forecasts
2021
The paper “Spring fires in Russia: results from participatory burned area mapping with Sentinel-2 imagery” released
Animation of the fires in Turkey released
Mapping wildfires in Lebanon
Animation of the fires in Greece released
2022
The global hotspot statistics tool updated.This tool can be used to compare MODIS hotspots over the years or with the long-term averages (2001 - 2022)
2023
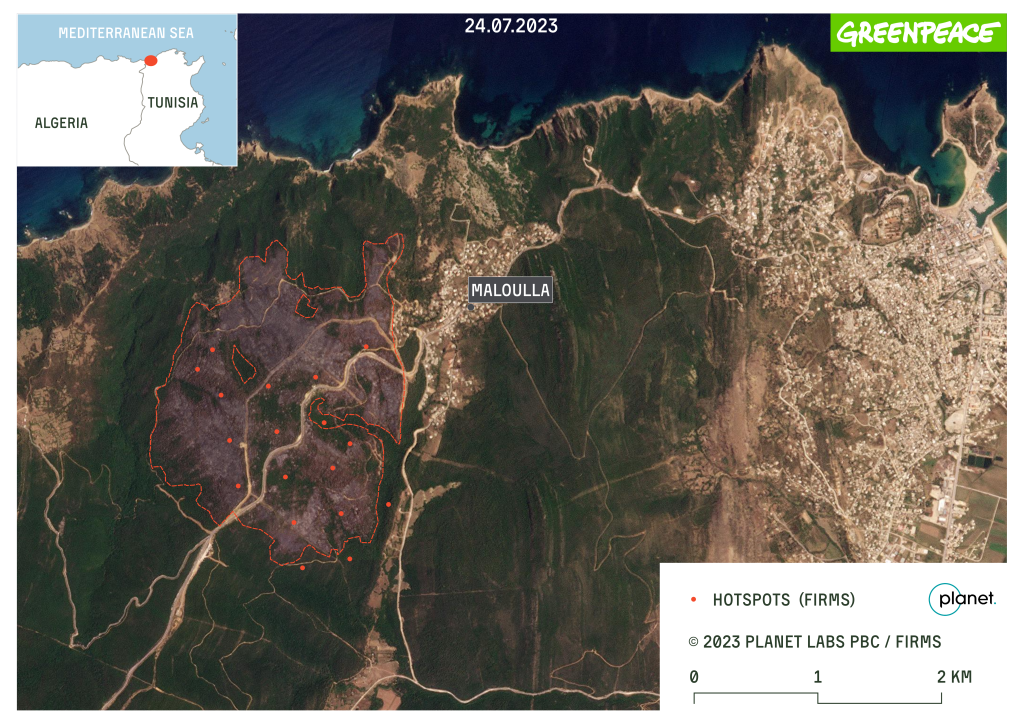
An animation of a wildfire burning more than 1000 hectares in Tunisia is created.